Round and Round the Cycles of the World Sugar Markets Turn
Guest Article by © Julian Price
Round and round the cycles of the world sugar markets turn. At times, influential factors reinforce an upward momentum for prices, or at other times they’re freewheeling downhill. The “bears” have come out of hibernation, many of them meeting recently at the 74th New York Sugar Dinner to reinforce their bearish viewpoints, and lately they’ve been chasing global sugar prices downhill.
The many and various forecasters of global sugar supply, demand and trade flows are like a peloton of cyclists, each of them trying to win the next stage of the “Tour de Sucre”. But the finishing line is never in sight. And to everything there is a season, turn! turn! turn! as the old song by the American rock band The Byrds put it.
© created by Julian Price data sources:
https://www.cftc.gov/MarketReports/CommitmentsofTraders/HistoricalCompressed/index.htm
https://www.ice.com/products/23/Sugar-No-11-Futures/data?marketId=6744230&span=3
The weather has been hot and dry in the Centre/South of Brazil recently, where no less than eighty percent (80%!) of all internationally traded sugar is forecast to be coming from this season. This weather has allowed the harvesting of another huge sugar cane crop – estimated to be more than 600,000,000 tonnes of cane in 2024/25 after 654,449,000 tonnes in 2023/24 – to proceed quickly, according to the latest preliminary UNICA statistics (1). In the crop year 2023/24 ending in March 2024, C/S Brazil produced 42,425,000 tonnes of sugar and 33.6 billion litres of bioethanol, being a sugar to bioethanol “mix” of 48.9 per cent for the season, compared with 33,750,000 tonnes of sugar production in C/S Brazil the year before in 2022/23. The truly Stakhanovite exertions of Brazilian truckers, freight forwarders and stevedores have smashed all logistical records this past year to ensure adequate supplies of sugar to the hungry global markets. But will the rains and cooler weather return as usual this winter in Brazil, possibly disrupting the harvest and logistics but nourishing next year’s sugar cane, or will there be too much rain, or will it be too cold?
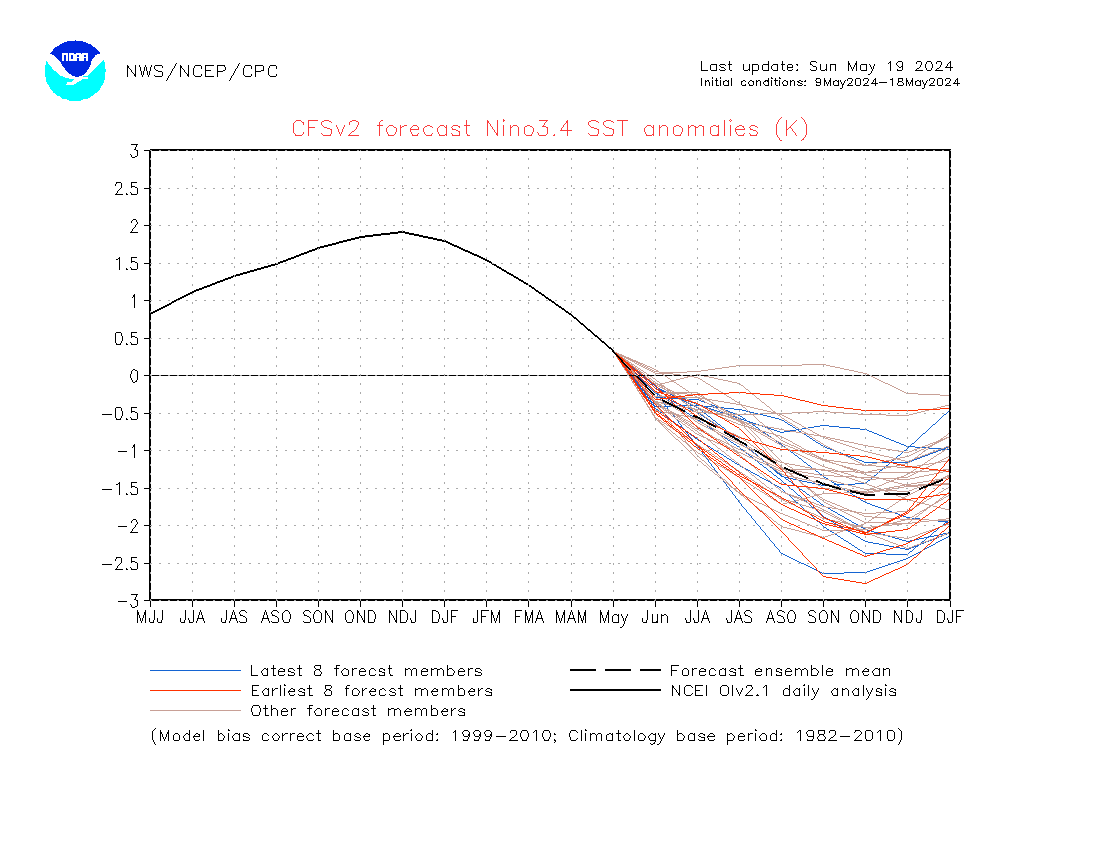
The cycles of the El Niño and La Niña weather phenomena will inevitably play their part. In Brazil, El Niño has historically caused droughts in the north and intense rainfall in the south. But according to NOAA’s latest forecast (2), El Niño may transition from “ENSO-neutral” to La Niña around June to August 2024. The encouraging news that the cycles of weather seem to be favouring Brazilian sugar cane production and exports prompted the ICE #11 July 2024 raw sugar futures price to close sharply down on 17 May at 18.13 cents/lb, or around 367 €/t FOB basis 96° polarization.
On the other side of the globe, Thailand’s sugar cane crop is expected to return to more than 100,000,000 tonnes in 2024/25, after a disappointing 82,300,000 tonnes in 2023/24, as El Niño wanes, and so the rains return, and Thai farmers’ appetite to grow cane returns (rather than cassava), and cane and sucrose yields return to normal levels.
In India, a neutral monsoon season is expected to begin in June this year whereas in most El Niño years, India experiences warm winters and low rainfall. As India goes to the polls in elections to the Lok Sabha in an electoral cycle of five years, in which some 50 million sugar cane farmers and their families will vote this month, there will likely continue to be zero official exports of sugar to the world market and meanwhile sugar cane will remain the most lucrative crop for farmers to grow thanks to Indian government incentives for sugar and bioethanol. According to the USDA (3), India’s sugar cane production is forecast to reach 416,000,000 tonnes in 2024/25 after 415,500,000 tonnes in 2023/24, yielding an estimated 33 million tonnes of sugar after a lower diversion of cane and “B-heavy molasses” to bioethanol production of just 1.7 million tonnes (sugar equivalent) compared with an earlier envisaged diversion of up to 4.5 million tonnes to meet the Government’s E20 fuel ethanol mandate. With Indian sugar consumption estimated by MEIR Commodities (4) to be around 30 million tonnes this season, the Indian sugar millers have recently requested the Government to allow further sucrose diversion towards bioethanol this year.
The impact of the El Niño phenomenon is also acutely felt in developing countries, notably in east and southern Africa where it causes drought and destitution too often; this region is the source of much sugar imported into Europe. The phenomenon is also felt in sugar cane fields in Central America, also an important origin of sugar for Europe and the wider Caribbean region, and in the Panama Canal which relies on the rain-fed reservoir Lake Gatún to operate its lock systems. The likely return to La Niña later this year brings with it the hope of adequate rainfall in Africa, Central America and a return to normal operations for container shipping through the Panama Canal – and hence globally – after over a year of traffic restrictions due to a severe drought. That said, the situation in the Middle East and the Red Sea is very worrying indeed.
The El Niño/La Niña phenomenon is not a “well-behaved” function. It fluctuates every two to seven years but is otherwise unpredictable over the long term as far as anyone knows (5).
Given the unpredictability of El Niño, not to mention many other influential factors, it follows that estimates of sugar production in countries around the world are similarly difficult to predict. However, sugar production around the world is most definitely seasonal, depending on latitude and the seasonality of rainfall in different sugar producing regions. The current picture of historical and forecast sugar production estimates by month is given in the graph below. Notice the sugar productions of South America (blue) and Southern Asia (yellow). Would that production be smooth throughout the year as may be assumed to be the case for sugar consumption where any seasonality tends to get lost in the statistical noise!
© created by Julian Price
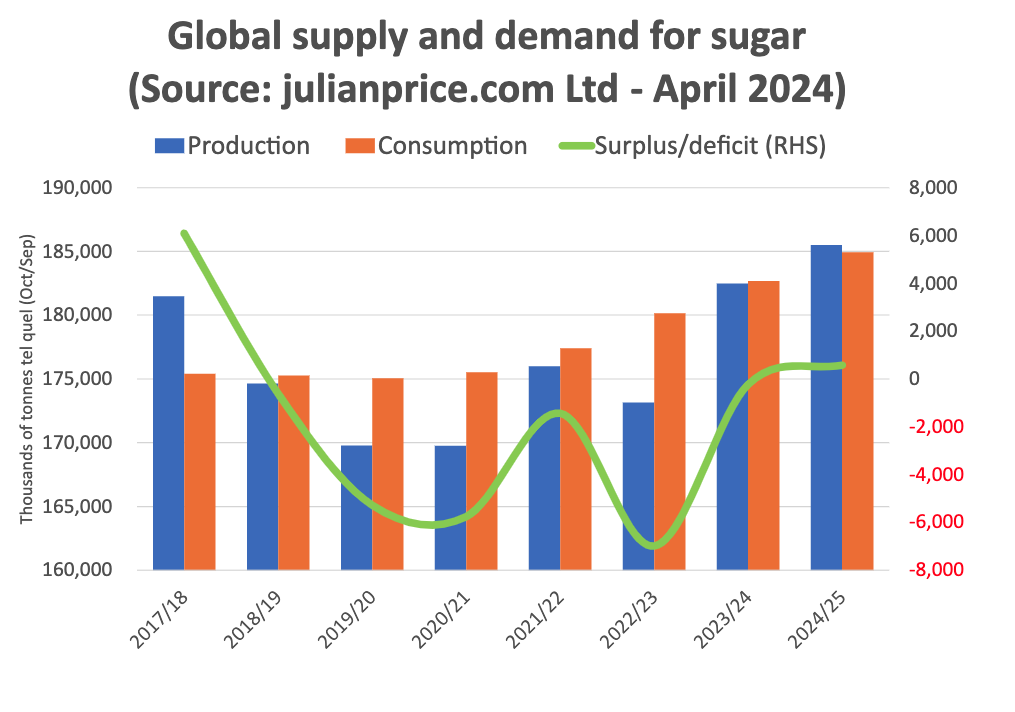
On an annual basis – we tend to use October/September marketing years for comparative purposes – the fluctuations of global supply and demand for sugar are the subject of intense debate. Our cyclists/forecasters tend to disagree between themselves, although it’s worth noting that the disagreements are of an order of magnitude of only a few percent on a global scale. At the moment, the outlook for the 2024/25 seems quite finely balanced between surplus and deficit. In recent weeks, the consensus of analysts’ forecasts seems to be that improving global supplies will be just about adequate to meet demand, but much must go well to avoid a deficit, notably the second half of the Brazilian crop must not be negatively impacted by a lack of rain, although too much rain could delay harvesting and export logistics.
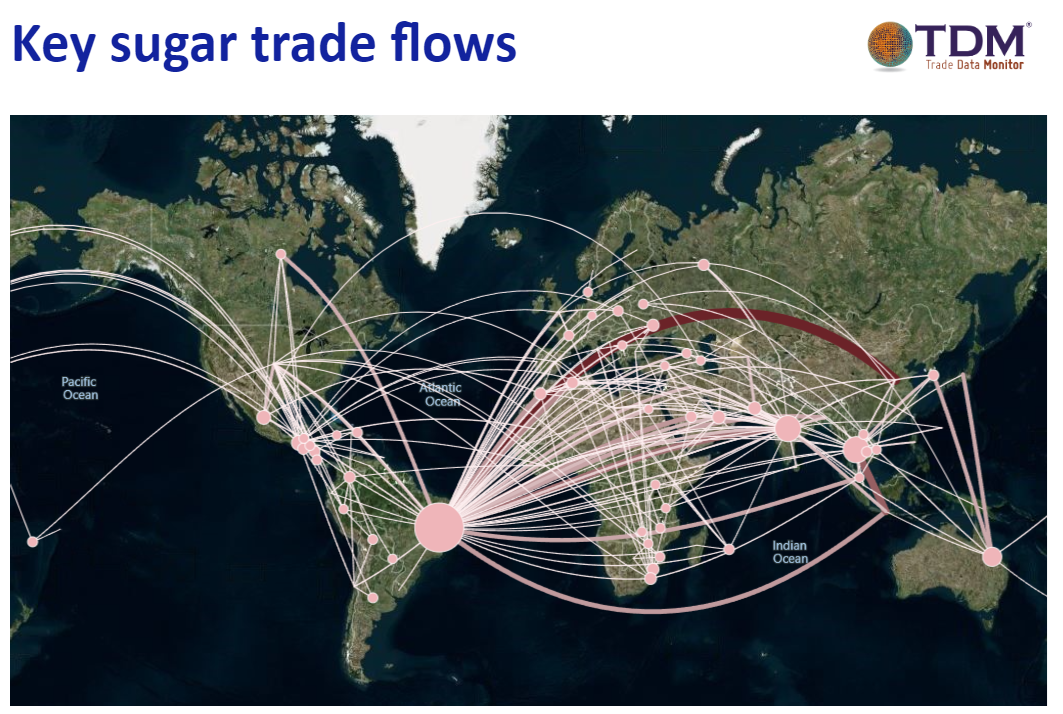
In fact, the world sugar market is not really influenced by sugar production estimates but rather by the trade flow estimates that emanate from surplus sugar production in exporting countries. After all, the ICE #11 raw sugar futures contract is for sugar to be delivered FOB to a list of world market ports for export internationally, not for sugar sold domestically or even regionally within trade blocs such as the EU (founded in 1968) or the Southern African Customs Union (founded in 1910) because these latter quantities of sugar are not for sale on the world market. Hence the goal of analysts tends to be towards estimating the key international sugar trade flows which are priced based with reference to the ICE #11 contract. One may picture our cyclists cycling blind on the racetrack: they only have a rear-view mirror to guide them – the rear-view mirror being historic sugar trade data. A good source of these data is https://tradedatamonitor.com/ which can be used to draw a picture of key sugar trade flows and, with the help of estimates of sugar supply and demand, to draw a picture of future trade surpluses and deficits – imbalances which international sugar traders make it their business to bring into balance.
© created by Julian Price data sources:
https://comexstat.mdic.gov.br/en/home
https://tradedatamonitor.com/
In in 2024/25, by far the largest sugar trade flow will be very likely be between the huge surplus in Brazil and the growing demand of China. This trade flow is forecast to amount to around four million tonnes, but timing of Chinese demand and the vagaries of Chinese import regulations and substitution of sugar for sugar imports in blends and local production of artificial sweeteners will be key metrics to analyze in order to make a reasonably accurate forecast. Hot on the heels of this flow, are the trade flows between Brazil and the Middle East and North African refineries in Algeria, Saudi Arabia and Morocco, and between Brazil and Indonesia, each of these are forecast to be between one and two million tonnes in 2024/25.
© created by Julian Price data sources:
https://comexstat.mdic.gov.br/en/home
https://tradedatamonitor.com/
© created by Julian Price data sources:
https://tradedatamonitor.com/
Putting this altogether, the “proof of the pudding” for the global sugar markets, and our cyclists’ scorecard, is to be found every day on sugar traders’ screens. The culmination of all that legwork are forward prices for ICE #11 sugar futures and the spreads between the various traded months, July, October, March and May. On the date of going to print, this forward curve is an almost perfect sine wave which may be drawn by cycling around the clock face, although perhaps with a slightly bearish undertone as the impact of earlier high prices translates into higher sugar production and thence to lower prices, and so the next stage of the Tour de Sucre will inevitably begin again.
1 https://unicadata.com.br/
2 https://www.cpc.ncep.noaa.gov/products/CFSv2/CFSv2seasonal.shtml
3 https://fas.usda.gov/data/india-sugar-annual-8
4 https://www.linkedin.com/company/meir-commodities-india-pvt-ltd/
5 https://origin.cpc.ncep.noaa.gov/products/analysis_monitoring/ensostuff/ONI_v5.php
Would you like to discuss this in more detail? Feel free to contact us


