Climate-friendly Nutrition – How Does it Work?
The impact of a product on the climate is playing an increasingly important role for consumers in their purchasing decisions (“conscious consumption”). Part of Südzucker Sugar Division’s commitment to sustainability is to inform consumers about all the properties of beet sugar. Details about these climate impacts can be classified under the impact area “Conscious Consumption”.
We have therefore taken a deeper look at the climate footprints of different diets.
Specifically, we looked at the carbon footprints of four lunches that can be assigned to different diets. The starter consists of white bread and olives, the main course and dessert can be differentiated as follows:
- roasted beef with potatoes and broccoli; yoghurt with strawberries, sweetened with sugar
- roasted chicken breast with potatoes and broccoli; yoghurt with strawberries, sweetened with sugar
- fried chicken breast with potatoes and broccoli; yoghurt with bananas, strawberries and honey
- potato pan with broccoli, pulses and peanuts; yoghurt with strawberries, sweetened with sugar
The meals were composed in such a way that they had the same amount of energy provided and as realistic a macronutrient ratio as possible (approx. 15-20% proteins, approx. 30% fats and approx. 50-55% carbohydrates).
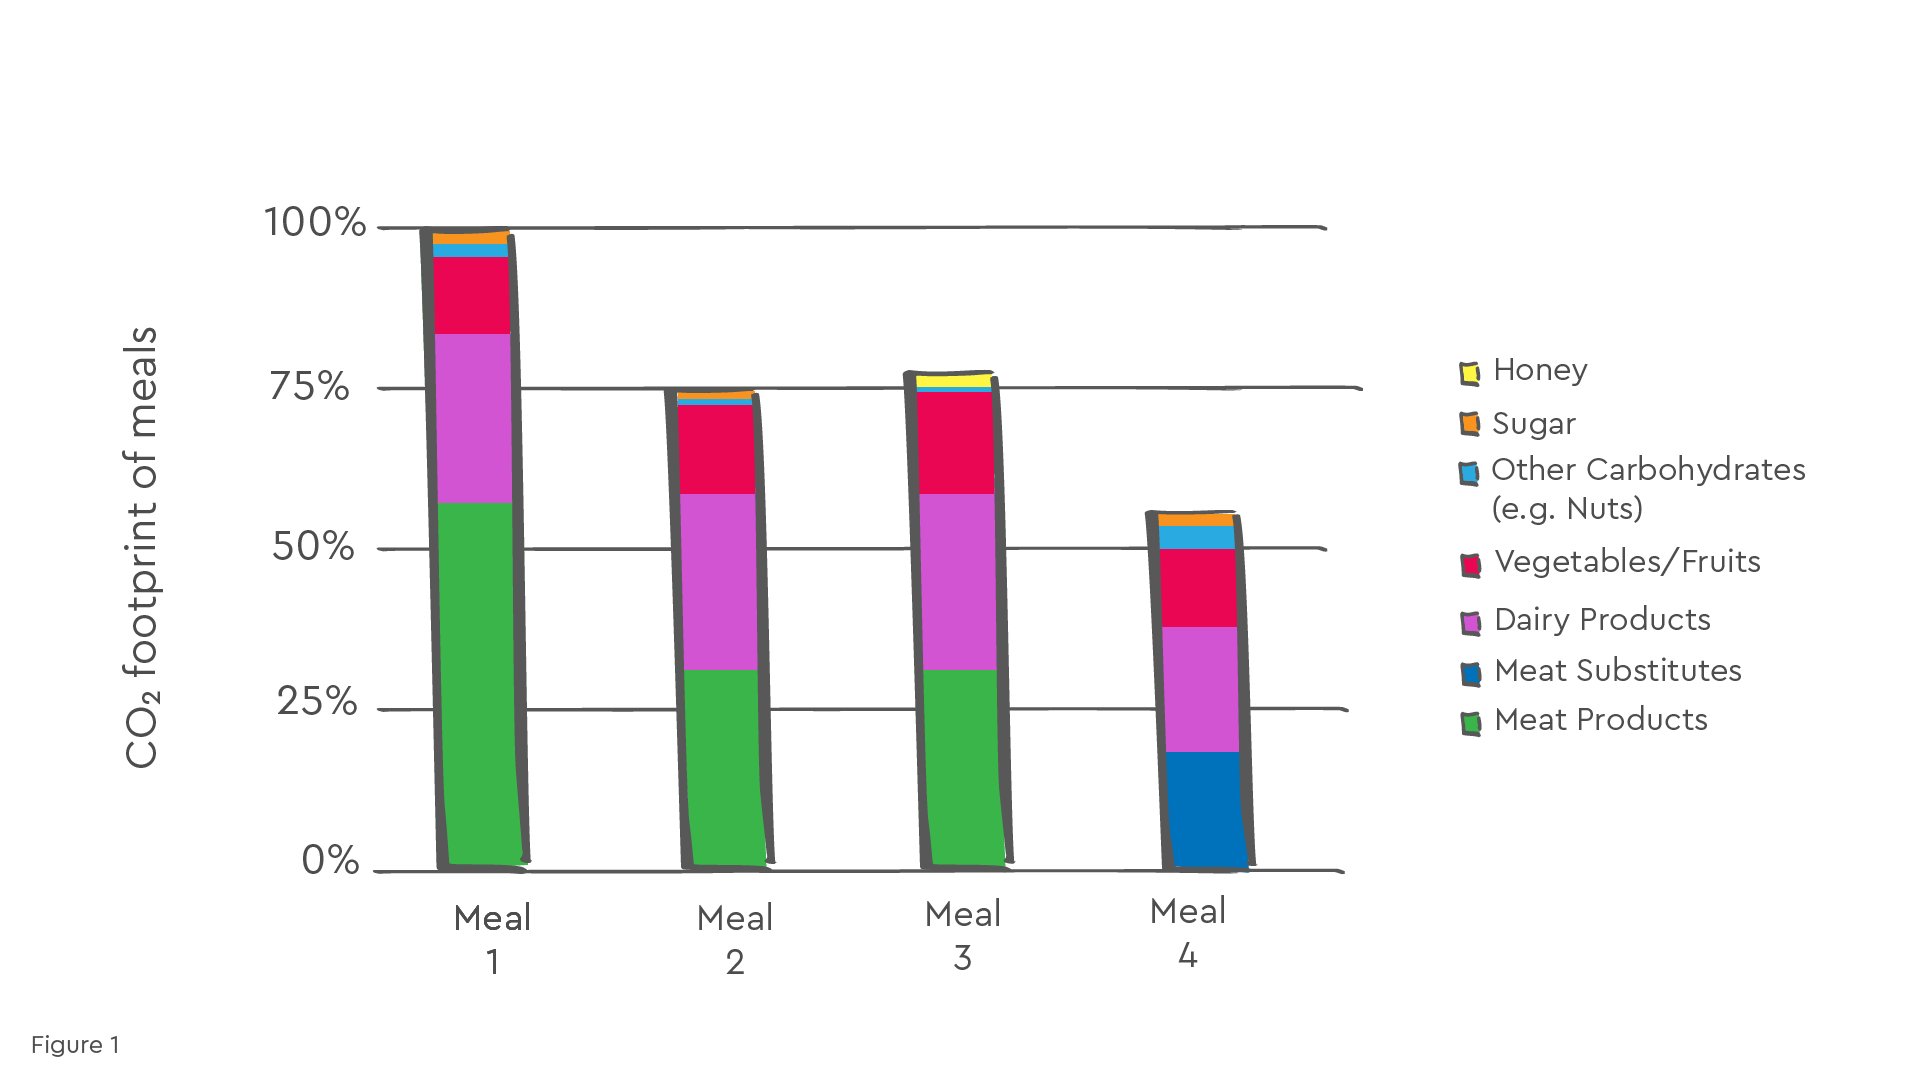
The calculated carbon footprints of the four meals are shown in Figure 1. According to this, the first meal has the largest footprint, with almost 85% of the climate-relevant greenhouse gas emissions being attributable to the main ingredient beef and consumed dairy products (yoghurt and butter). A significant reduction in CO₂ emissions (around 25%) can be achieved by replacing beef with poultry meat, as can be seen in meals 2 and 3. The difference between meals 2 and 3 is due to the replacement of sugar with honey, which, while maintaining the amount of energy provided, leads to a slightly higher demand for other foods at meal 3. The carbon footprint is even lower for the fourth meal, for which a vegetarian diet was assumed and existing meat products were replaced by meat substitutes (soy and pea-based). Despite the same amount of energy provided, the fourth meal has almost half the carbon footprint of meal 1 and illustrates how the carbon footprint of our diet can be improved by avoiding meat products more often and relying more on plant-based protein sources.
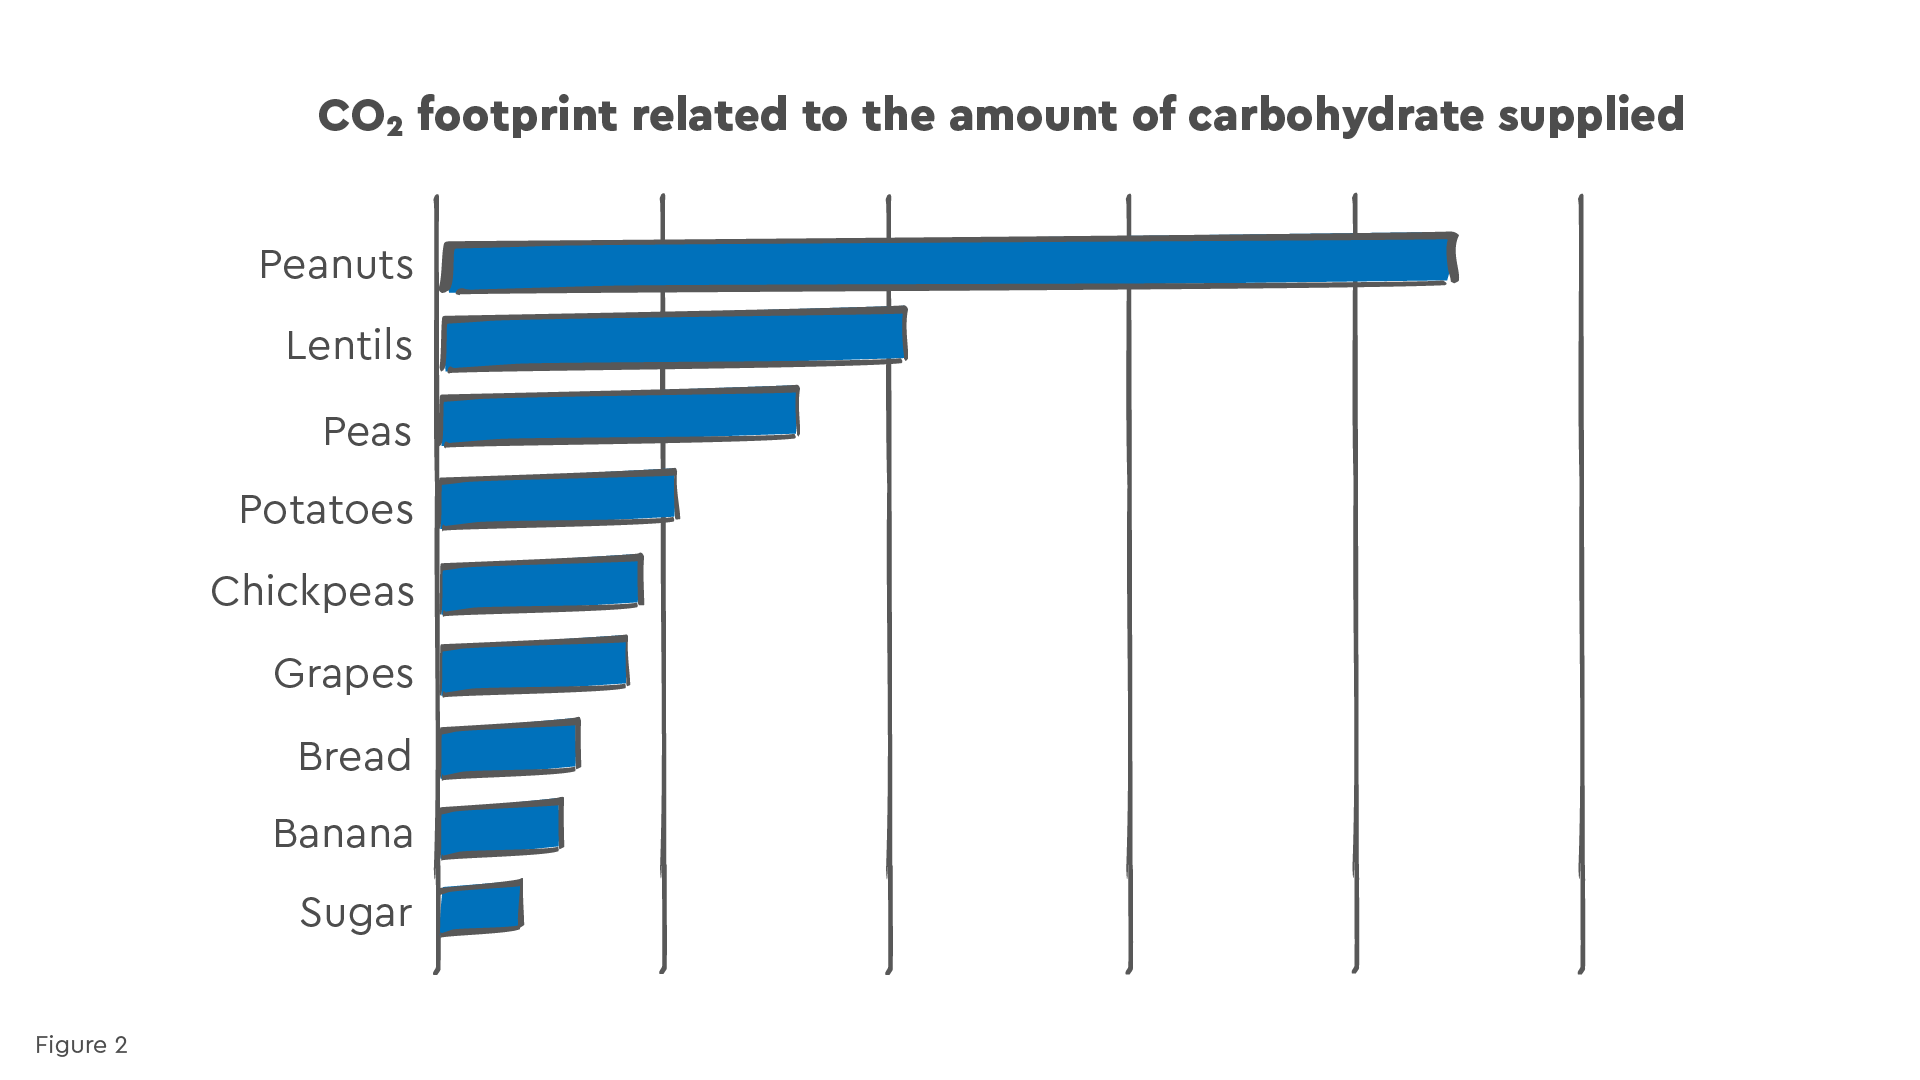
The results of the study also show that especially carbohydrate-rich components of the daily diet are of minor importance in the context of causing greenhouse gas emissions and are often considered comparatively climate-friendly in relation to the amount of calories consumed. Figure 2 shows a comparison of the carbon footprints of different carbohydrate-based foods based on the amount of carbohydrates consumed, with sugar being the most climate-friendly of these foods. On the one hand, this shows that sugar, with a low contribution to the CO₂ footprint in the area of daily nutrition, simultaneously makes a high contribution to the supply of carbohydrates. On the other hand, this shows that a reduction of sugar in the daily food intake worsens the climate balance, since other foods with a higher CO₂ footprint have to close the resulting carbohydrate and energy deficit.
Part of the Sugar Division’s commitment to sustainability is to inform consumers about all the properties of beet sugar. We have therefore taken a closer look at the climate impact of different types of sugar as they end up on consumers’ tables in Europe: Beet sugar, cane sugar, glucose syrup, fructose syrup and honey.
In common life cycle assessment databases and the relevant specialist literature, a very wide range of values can be found for the carbon footprint of cane sugar, from just under 60 to over 1,500 kg CO₂ equivalents (CO₂eq.) per tonne of cane sugar. It should be noted that these values typically refer to raw cane sugar ex sugar factory. When this sugar is made available to customers, further emissions are of course caused by transport and the additional refining that is usually necessary.
In the context of a comparison from the perspective of an European end customer, a realistic value for a carbon footprint of cane sugar is therefore composed as follows:
- Raw cane sugar at the factory gate in the country of production: approx. 300 to 450 kg CO₂eq. per t of sugar (see e.g. Rein, 2010; Fisher, 2013).
- Transport to Europe: approx. 100 to 200 kg CO₂eq. per t of sugar
- Additional refining in Europe: approx. 200 kg CO₂eq. per t of sugar
This results in the following picture of the carbon footprint of cane sugar:
- Imported raw cane sugar: approximate range of 600 to 850 kg CO₂eq. per t of sugar
- Imported white cane sugar: range of approximately 400 to 650 kg CO₂eq. per t of sugar
For cane sugar, it must also be taken into account that land use changes (LUC) often take place in the producing countries, i.e. an expansion of the agriculturally used area through conversion of forest, nature areas or grassland into arable land. These changes in land use (e.g. clearing of forest and use as pasture or conversion of permanent grassland to cropland) release larger amounts of carbon previously stored long-term in soils or vegetation and escape into the atmosphere. The LUC effects usually lead to emissions of several 100 kg CO₂eq. per tonne of cane sugar. This typically results in a CO₂ footprint of about 1,000 to 1,500 kg CO₂eq. per t of cane sugar for cane sugar imported from a producing country with land use changes.
Beet sugar from Western European production typically has a CO₂ footprint of about 500 to 600 kg CO₂eq. per t of sugar. If the factory is operated with renewable energy (e.g. biogas), the value is reduced by about 50 %.
For the other forms of sugar, there is significantly less data on their CO₂ footprints in life cycle assessment databases and literature. For glucose syrup, this appears to be between about 800 and 1,750 kg CO₂eq. (e.g. Blanco et al., 2020), for fructose syrup about 800 kg CO₂eq. (Kis et al., 2019) and for honey between about 400 and 2,500 kg CO₂eq. (e.g. Pignagnoli et al., 2021) per tonne of product.
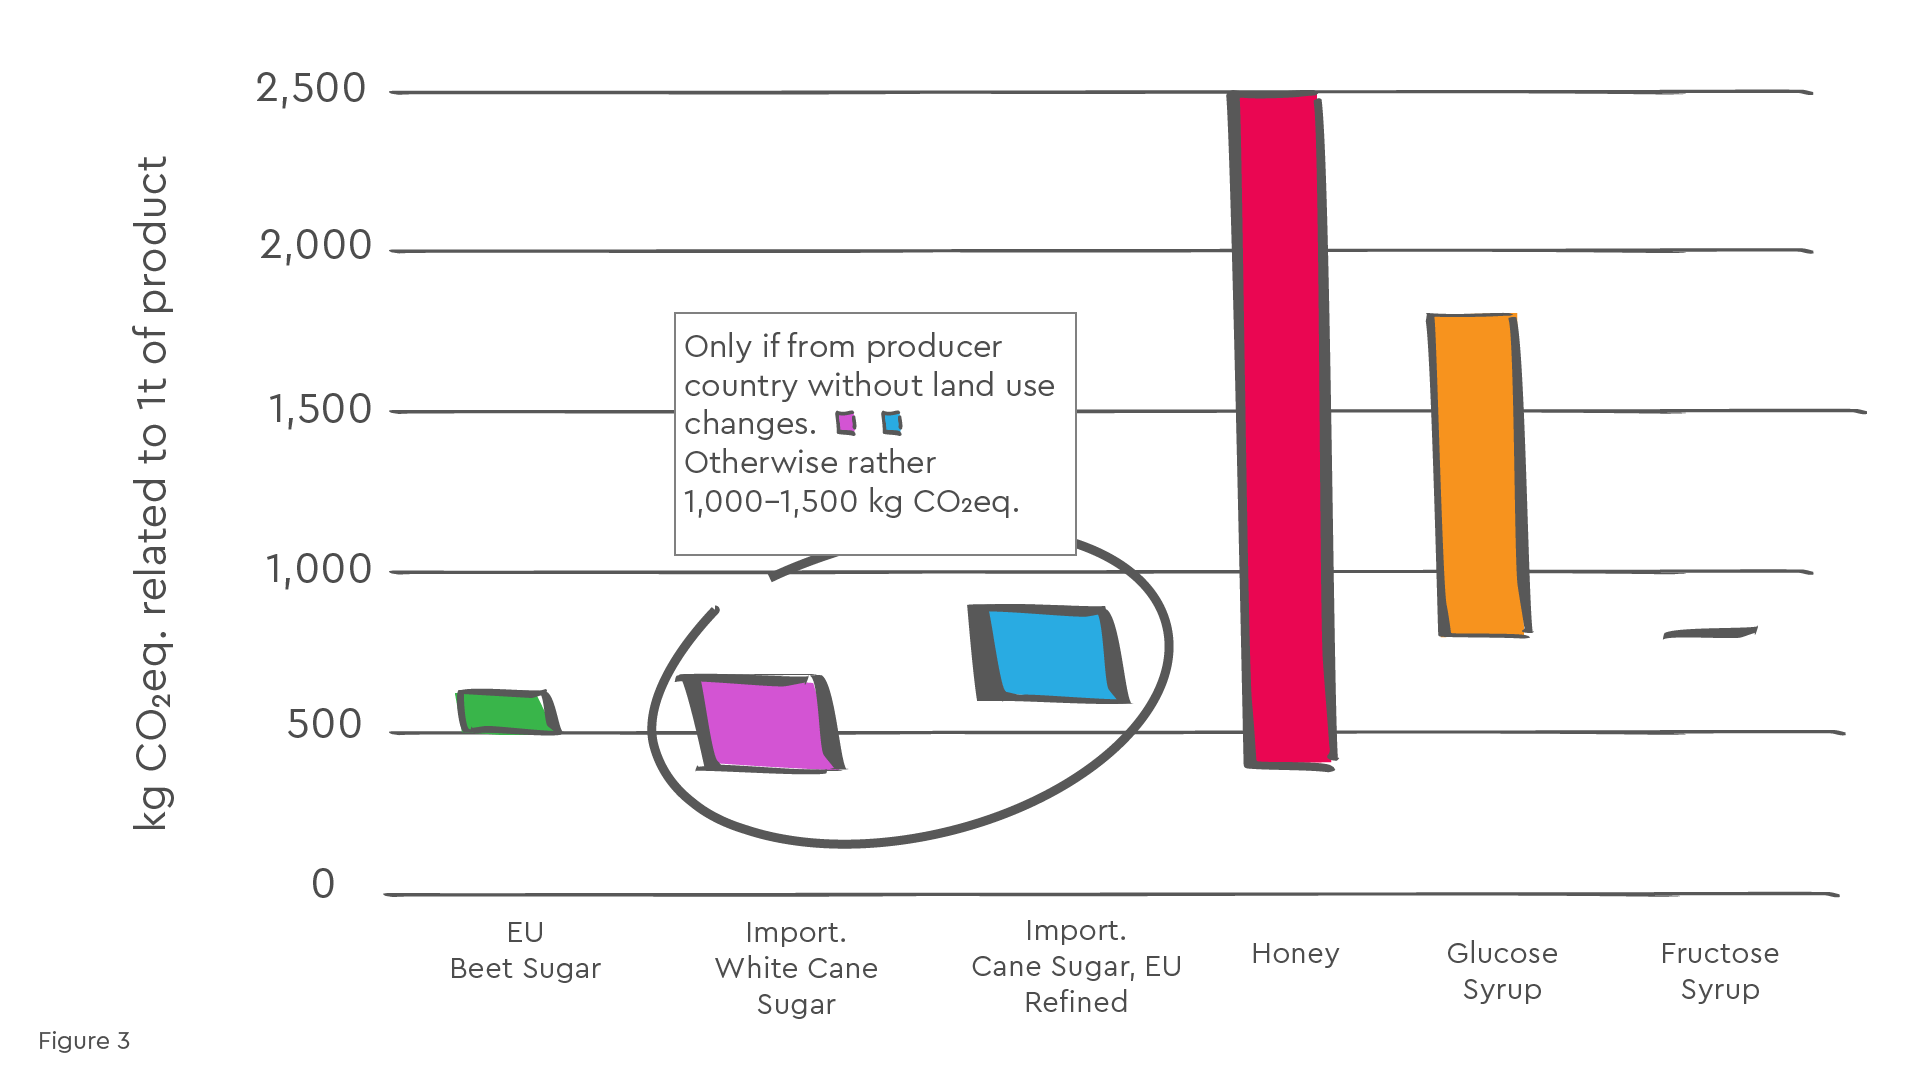
Figure 3 shows that EU beet sugar is generally the most advantageous from a climate perspective. At best, imported white cane sugar is comparable. However, this is subject to the restriction that it must come from a producer country in which no release of stored carbon takes place as a result of land-use changes that are objectively related to cane cultivation.
Honey interestingly tends to have a higher carbon footprint according to the information available in the literature.
Unlike cane sugar, which is produced in the sugar factory using bagasse as fuel, the carbon footprint of beet sugar can also be further reduced if the sugar factory is operated with renewable energy instead of fossil energy as is the case today. With its climate strategy, Südzucker has decided to follow this path and gradually make the factories climate-neutral by switching to renewable energies, in line with the goals of the European Union stated in the Green Deal.
In addition, the carbon footprint of beet sugar can be further improved by identifying and exploiting reduction potential in the areas of beet cultivation and logistics.
Are you interested in further information or a detailed discussion about the results and findings?
Literature
Blanco et al. (2020)
Blanco, J., Iglesias, J., Morales, G., Melero, J., Moreno, J.; Comparative Life Cycle Assessment of Glucose Production from Maize Starch and Woody Biomass Residues as a Feedstock; Applied Sciences 10 (8):2946; 2020
Fisher (2013)
Fisher, J.; The variability and drivers of the carbon footprint of cane sugar; International Sugar Journal; ISSN 0020-8841; 2013
Kis et al. (2019)
Kis, F., Maravic, N., Szabolcs, K., Seres, Z.; Life Cycle Assessment of Liquid Inverted Sugar and High Fructose Corn Syrup; Analecta Technica Szegedinensia, Vol. 13, No. 1; ISSN 2064-7964; 2019
Pignagnoli et al. (2021)
Pignagnoli, A., Pignedoli, S., Carpana, E., Costa, C., Dal Prà, A.; Carbon Footprint of Honey in Different Beekeeping Systems; Sustainability 2021, 13, 11063; https://doi.org/10.3390/su131911063; 2021
Rein (2010)
Rein, P.W.; The carbon footprint of sugar; Sugar Industry, Vol. 135, No. 7; S. 427 – 434; 2010